Since the 2008 presidential election, when the Barack Obama campaign used YouTube to defuse controversy over the candidate's relationship with pastor Rev. Jeremiah Wright, the video site has been an increasingly contested political battleground around election season. According to a 2014 Pew study, close to one quarter of YouTube viewers get political news from the video-hosting platform. With the upcoming presidential election heating up, viewership data gathered by YouTube's analytics team provides an interesting peek at which candidates are commanding the most attention online. Here's what the video platform has found so far, based on 2015 viewership:
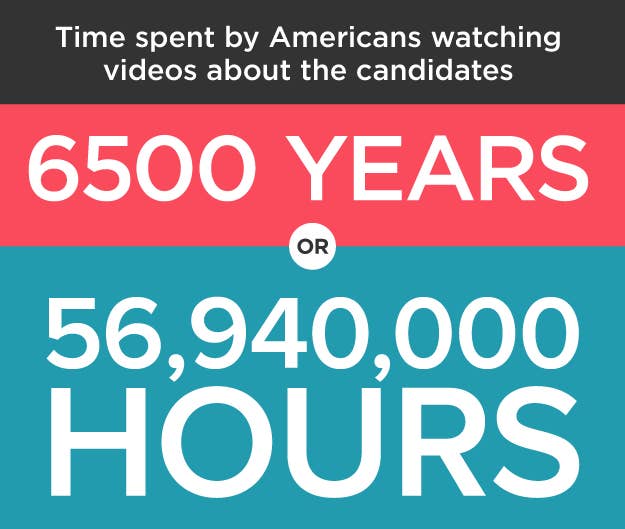
To date, the 2016 presidential election has driven 750,000,000 views on YouTube.
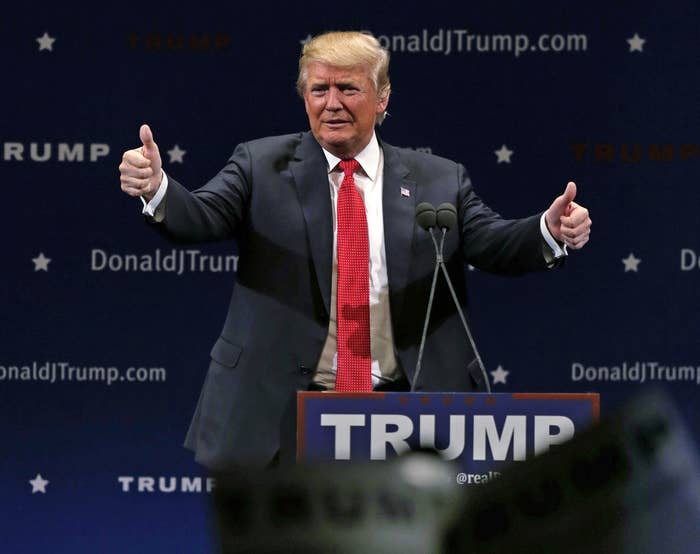
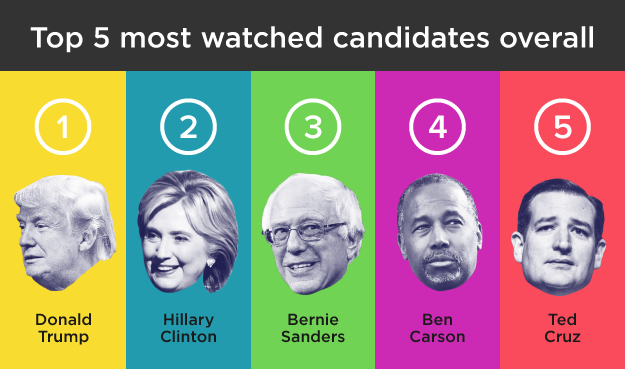
Donald Trump is the most watched candidate, followed by Hillary Clinton.
It's hardly surprising that Trump commands the top spot on YouTube in terms of total views. But those views aren't comprised exclusively of campaign videos. Clips classified as entertainment and comedy are also included, and Trump has amassed some 75 million views for his late-night show appearances alone. And, thanks to the multitude of clips posted by news shows endless discussing his candidacy, Trump has the most videos of any candidate on YouTube.
For almost all the candidates, having the most videos on YouTube leads to the most views.
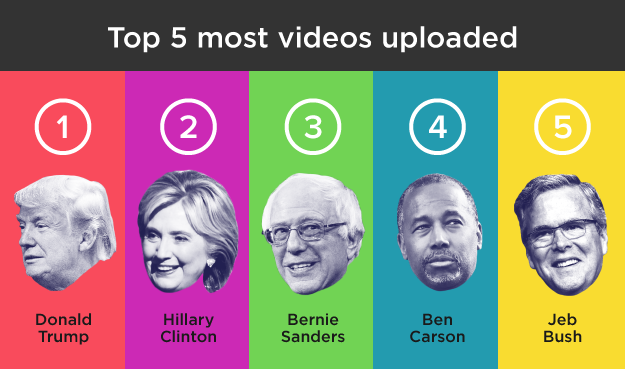
Trump leads the GOP in all categories except one big one.
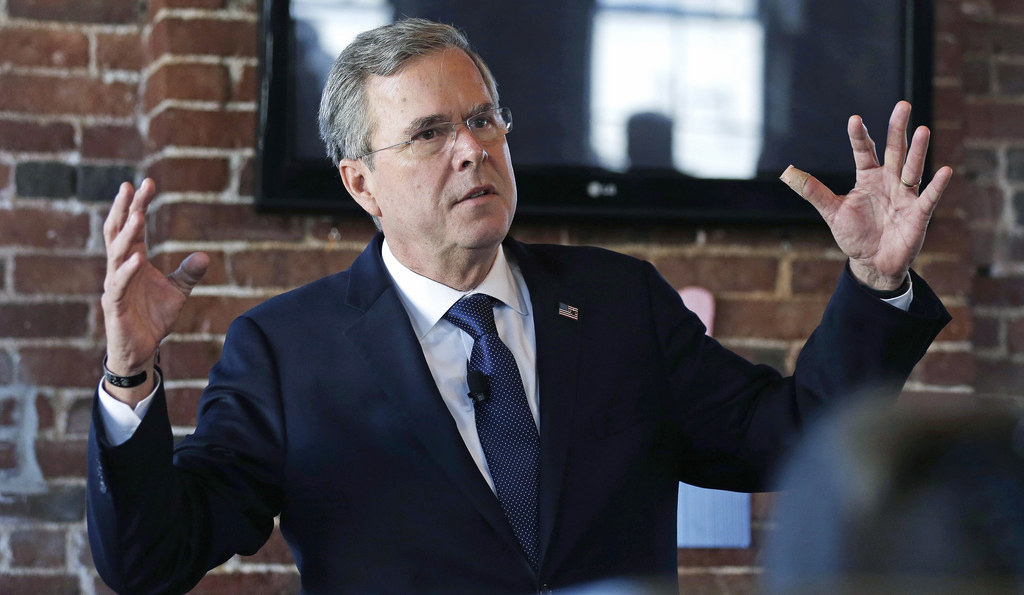
According to YouTube, Jeb Bush had the most watch time per view on videos in which he is featured, followed by Rand Paul and Carly Fiorina. In other words, while he didn't even rank in the top five most watched candidates overall, the people who did watch Bush videos tended to watch them for longer periods of time.

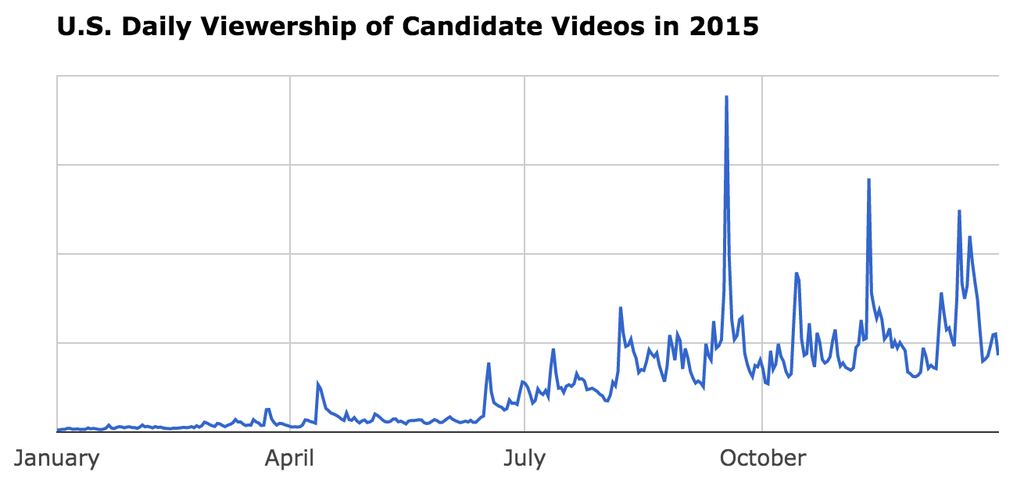
A final metric, and one that should come as no surprise: The biggest election-related spikes in YouTube viewership typically follow a debate.