
Melanie Perkins, CEO of Canva, a company that makes online graphic design tools, wants her to software to “power the modern workforce.” But what she really wants is for people to stop making ugly graphics.
That’s why the company is debuting Canva for Charts, a simple tool to turn columns of data into pie charts and bar graphs with tasteful color schemes and fonts.
Canva, launched in 2013 in Perth, Australia, allows you to easily create and collaborate on visual content—like invitations, graphics, posters—and save them in the cloud. Most of the images you can make with Canva resemble greeting cards and are meant to be shared on social media. But with the introduction of Charts, Perkins is hoping that eventually, you’ll start using Canva in your office.
Regular Canva:

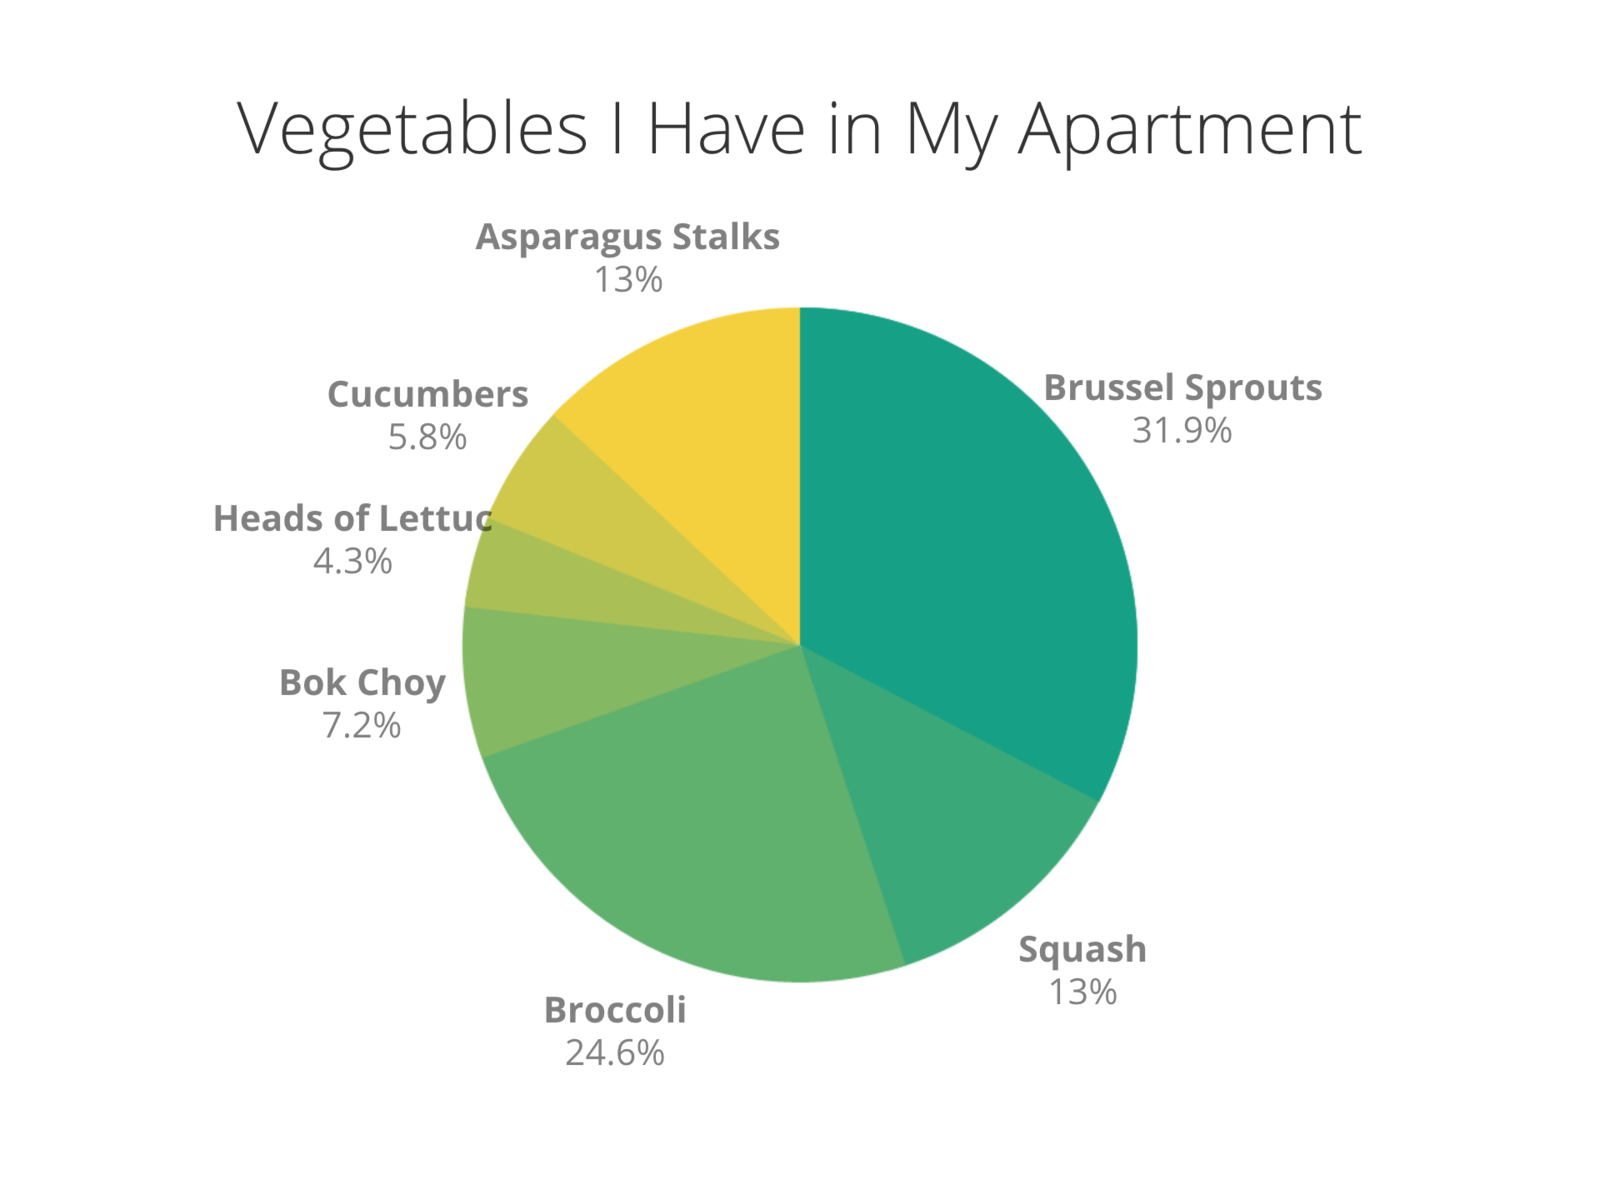
Canva for Charts:

Why the shift from cute social images to hard data? “Every profession is becoming more visual. There’s a huge demand for visual content in every industry,” Perkins told BuzzFeed News. She said things like sales pitches and investment decks — traditionally drab parts of doing business — are places where companies are looking for much more visual oomph in 2016.
Canva has big goals. Perkins hopes Canva for Charts will someday replace legacy software like Microsoft Office or Adobe Creative Cloud. It’s not total war, though: Canva users will still be able to download their charts in PDF format or as images to insert them into other applications.
Either way, it will be an uphill battle. Canva has 12 million users, Perkins said. The Microsoft Office suite boasts 1.2 billion users worldwide, according to Microsoft. And Adobe Creative Cloud cites a community of 6.6 million people on its Behance social network as of March 2016, though the company has not disclosed the total number of Creative Cloud subscribers. Convincing more than a billion individual users — and the historically slow-moving corporations where they work — to switch to a new design software will not be easy.
Canva’s ambition to take down legacy software recalls another attempt to make more user-friendly professional software: Prezi, which went after PowerPoint several years ago. As of February 2016, it has registered 60 million users, which is still a drop in the bucket compared to Office’s one billion plus. Perkins, though, told BuzzFeed News that Canva will make more of an impact because of its “high quality ingredients, previously only accessible to designers and a niche market, that we combine and make available to everyone. Now lots of people can use them.”
“Most design tools are too complicated,” Perkins added. “They’re hard to use and look bad.” Canva, she says, is so simple to use, it doesn’t require any design training.
On a larger scale, Perkins hopes that being able to save and share work in the cloud will eliminate the frustrating, chaotic workflow of sending multiple versions of visual content back and forth to a designer to make every single change. However, Microsoft Office 365 also allows users to save their creations in the Cloud and collaborate on them, as does Adobe Creative Cloud.
Canva for Charts is free, like the other tools Canva offers, though Perkins said she can imagine a premium version in the future. Currently, about 50,000 teams pay for Canva for Work, the site’s professional subscription version, which retails for $120 per user per year or $12.95 per user per month. Canva also makes money when users buy stock images for $1 from its library.