This story was reported in partnership with The Trace, a nonprofit news organization dedicated to reporting on gun violence. Here’s where you can find its editorial independence and donor transparency policies.
American cities have become much safer since the crime wave of the 1980s and 1990s. So you might expect that with fewer cases to solve, police would be more likely to catch perpetrators. Yet the opposite is true: More and more shooters are getting away with their crimes.
Over the past year, The Trace and BuzzFeed News analyzed three historical FBI data sets — the Supplementary Homicide Report, the National Incident-Based Reporting System, and Return A — along with internal data that we obtained from 22 police departments. We also pored over scores of staffing audits and research papers.
We found that detectives are failing to make arrests in all but a fraction of murders and assaults committed with guns, leaving violence spiraling unchecked and whole neighborhoods traumatized. Arrest rates are lower when the victim is black or Hispanic.
Here are our five most striking takeaways.
1. Police are half as likely to make an arrest in a murder or assault involving a gun.
Typically, clearing a case means arresting a suspect, but police can also make an “exceptional clearance” when they have enough evidence to make an arrest but can’t, because, for example, the suspect is dead.
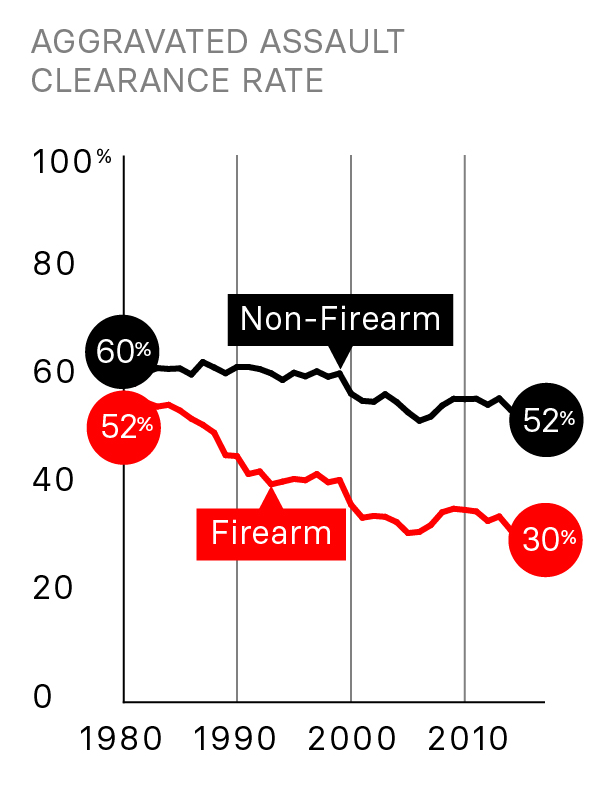
In the 1980s, the type of weapon used in a murder or assault appears to have made little difference in the likelihood that police would “clear” a case. Since then, the clearance rate for murders committed with firearms has dropped by around 20 percentage points, even as the clearance rate for murders committed with other weapons or by physical force appears to have improved.
The Trace/BuzzFeed News analysis of the FBI’s “Supplementary Homicide Report” data. It includes 202 urban police departments that have reported incident-level data on at least one murder to the FBI for 34 of the 38 years between 1980 and 2017.
For gun assaults, the clearance rate has also dropped by 20 points, falling to 30%. The rate for non-gun assaults has also dropped, but far less sharply.
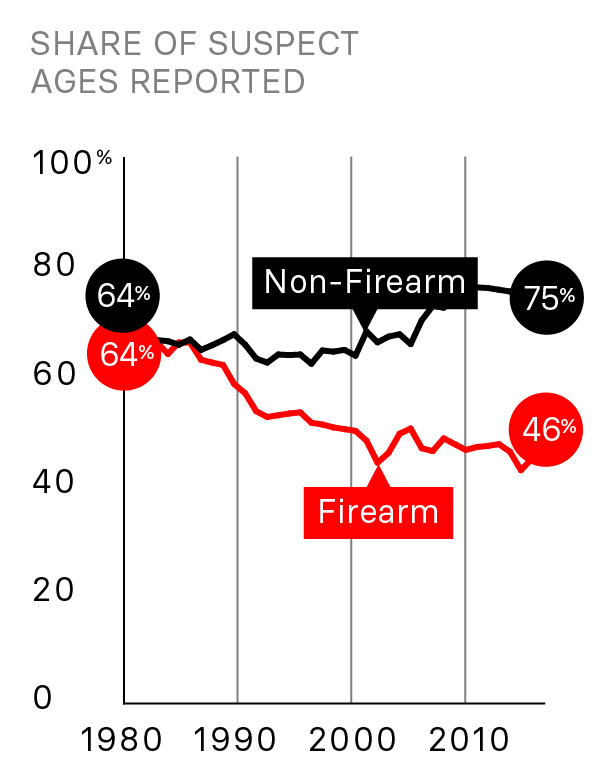
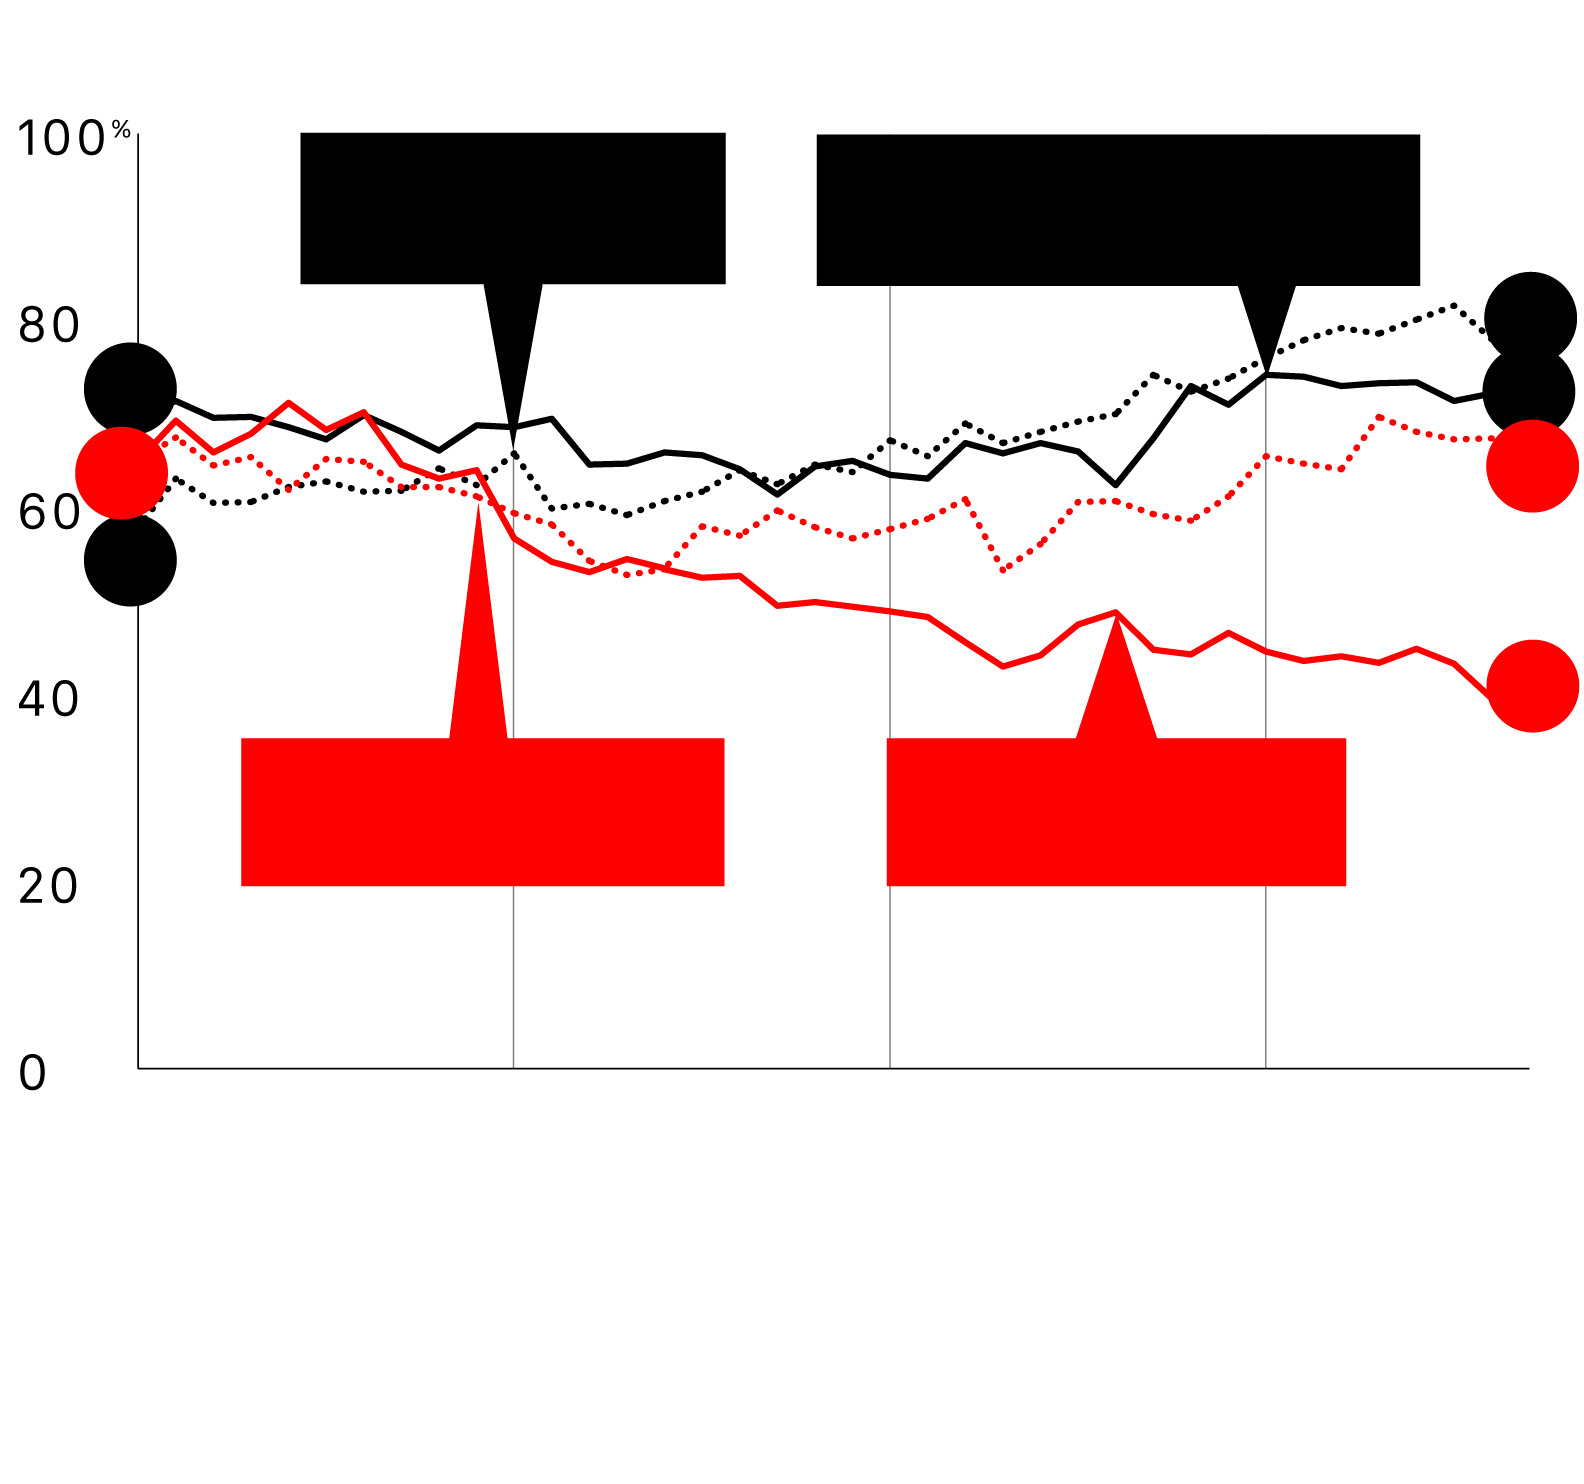
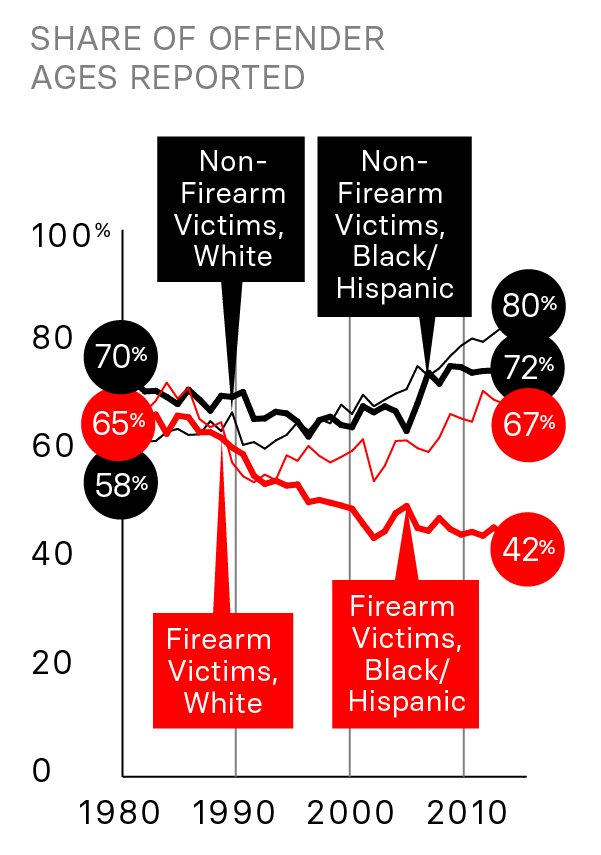
To perform our analysis, we used the FBI’s Supplementary Homicide Report, which tracks details like weapon type and victim and suspect demographics. Because the database does not include whether the case was cleared, we needed a way to gauge whether the police had identified a specific subject. For that, we used the inclusion of a suspect’s age.
This isn’t a perfect proxy for clearance rates. Police often identify a suspect but don’t have enough evidence to make an arrest; or police may have arrested a suspect but not reported their age to the federal government. Even so, our findings were supported when cross-checked with the other data sets.
While we restricted our analysis of FBI data to urban police departments that have consistently reported their crime statistics, we saw similar trends when looking at data from all agencies.
The Trace/BuzzFeed News analysis of the FBI’s “Return A” data, limited to the 234 urban police departments that have reported at least one clearance in each category for 34 of the 38 years between 1980 and 2017.
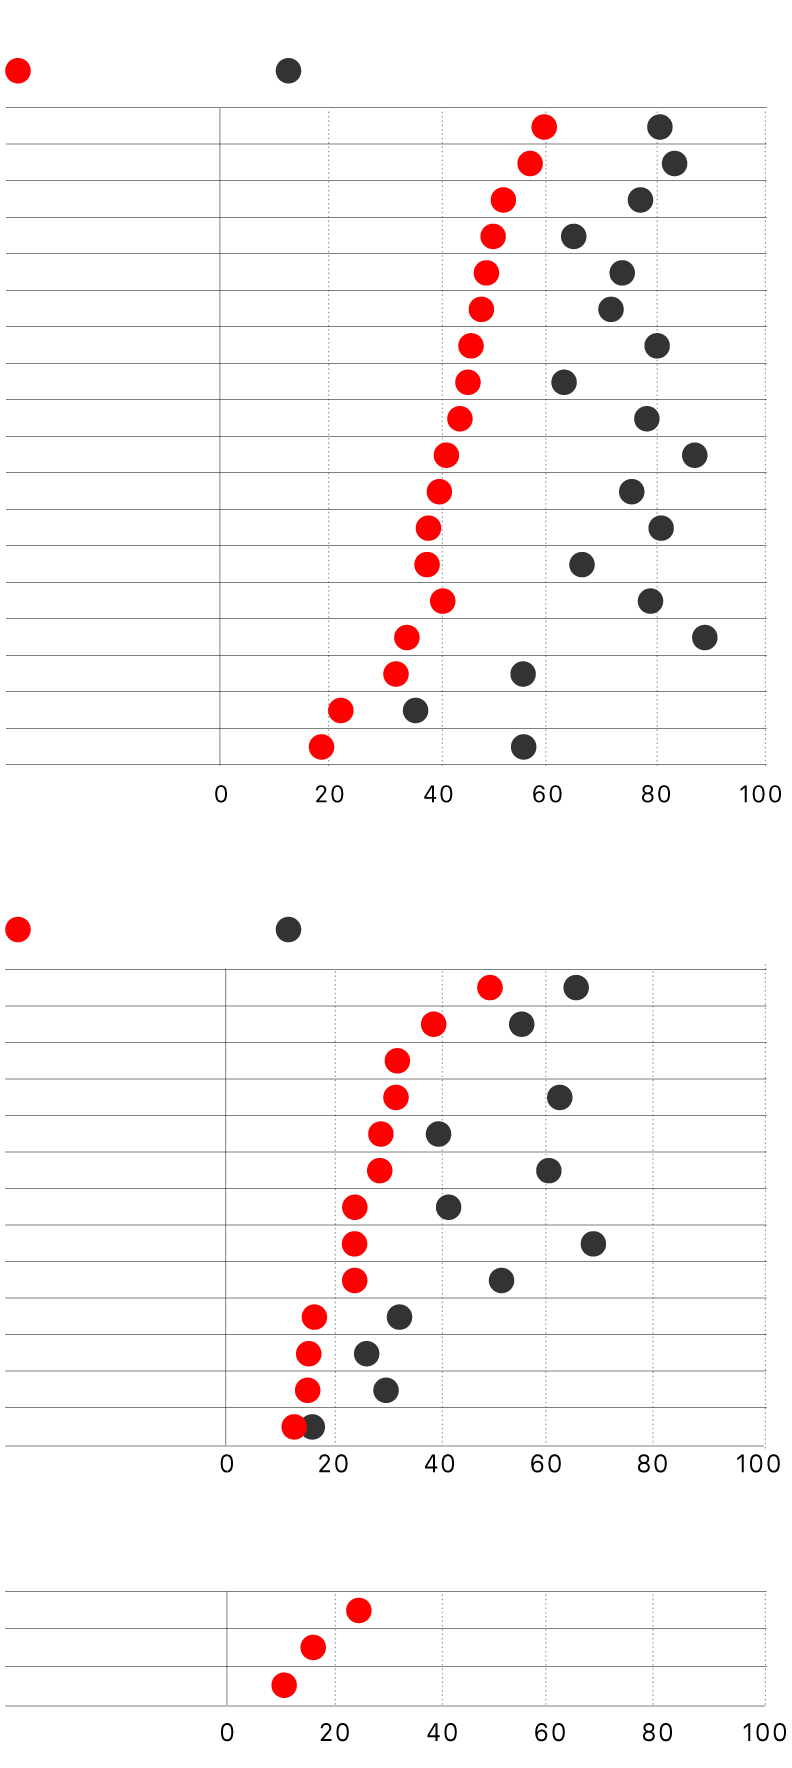
For every police department that provided internal data, including those in some of the safest and most prosperous cities in the country, arrest rates were lower when a firearm was used.
Los Angeles, Chicago, and Las Vegas each had arrest rates below 20% for gun assaults. A handful of agencies only gave us data for “nonfatal shooting” incidents — a designation that could include rapes, robberies, and assaults where shots were fired. San Francisco had a lower arrest rate than Newark, New Jersey — a city with nearly six times the number of shootings per capita.
The Trace/BuzzFeed News analysis of police data from 19 cities that reported arrest information for 2013–16. Excludes incidents with police victims, to the extent they were identifiable. Dallas data is for 2014–16 and excludes incidents involving juveniles or family violence. New York City and Boston data includes only 2016; Wilmington includes only 2014–16. St. Louis assault data includes only firearm incidents.
2. The failure to solve fatal shootings of black and Hispanic victims appears to account for the entire decline in murder clearance rates.
The clearance rate for cases involving black and Hispanic victims killed with guns appears to have dropped by more than 20 percentage points since the 1980s. Meanwhile, the rates for other victims — including white victims killed with firearms, and black and Hispanic victims killed by other means — appear to have improved.
The Trace/BuzzFeed News analysis of the FBI’s “Supplementary Homicide Report” data. It includes only the 202 urban police departments that reported incident-level data on at least one murder to the FBI for 34 of the 38 years between 1980 and 2017. Agencies often failed to report Hispanic ethnicity, so many victims classified as “White” in the data may in fact be Hispanic.
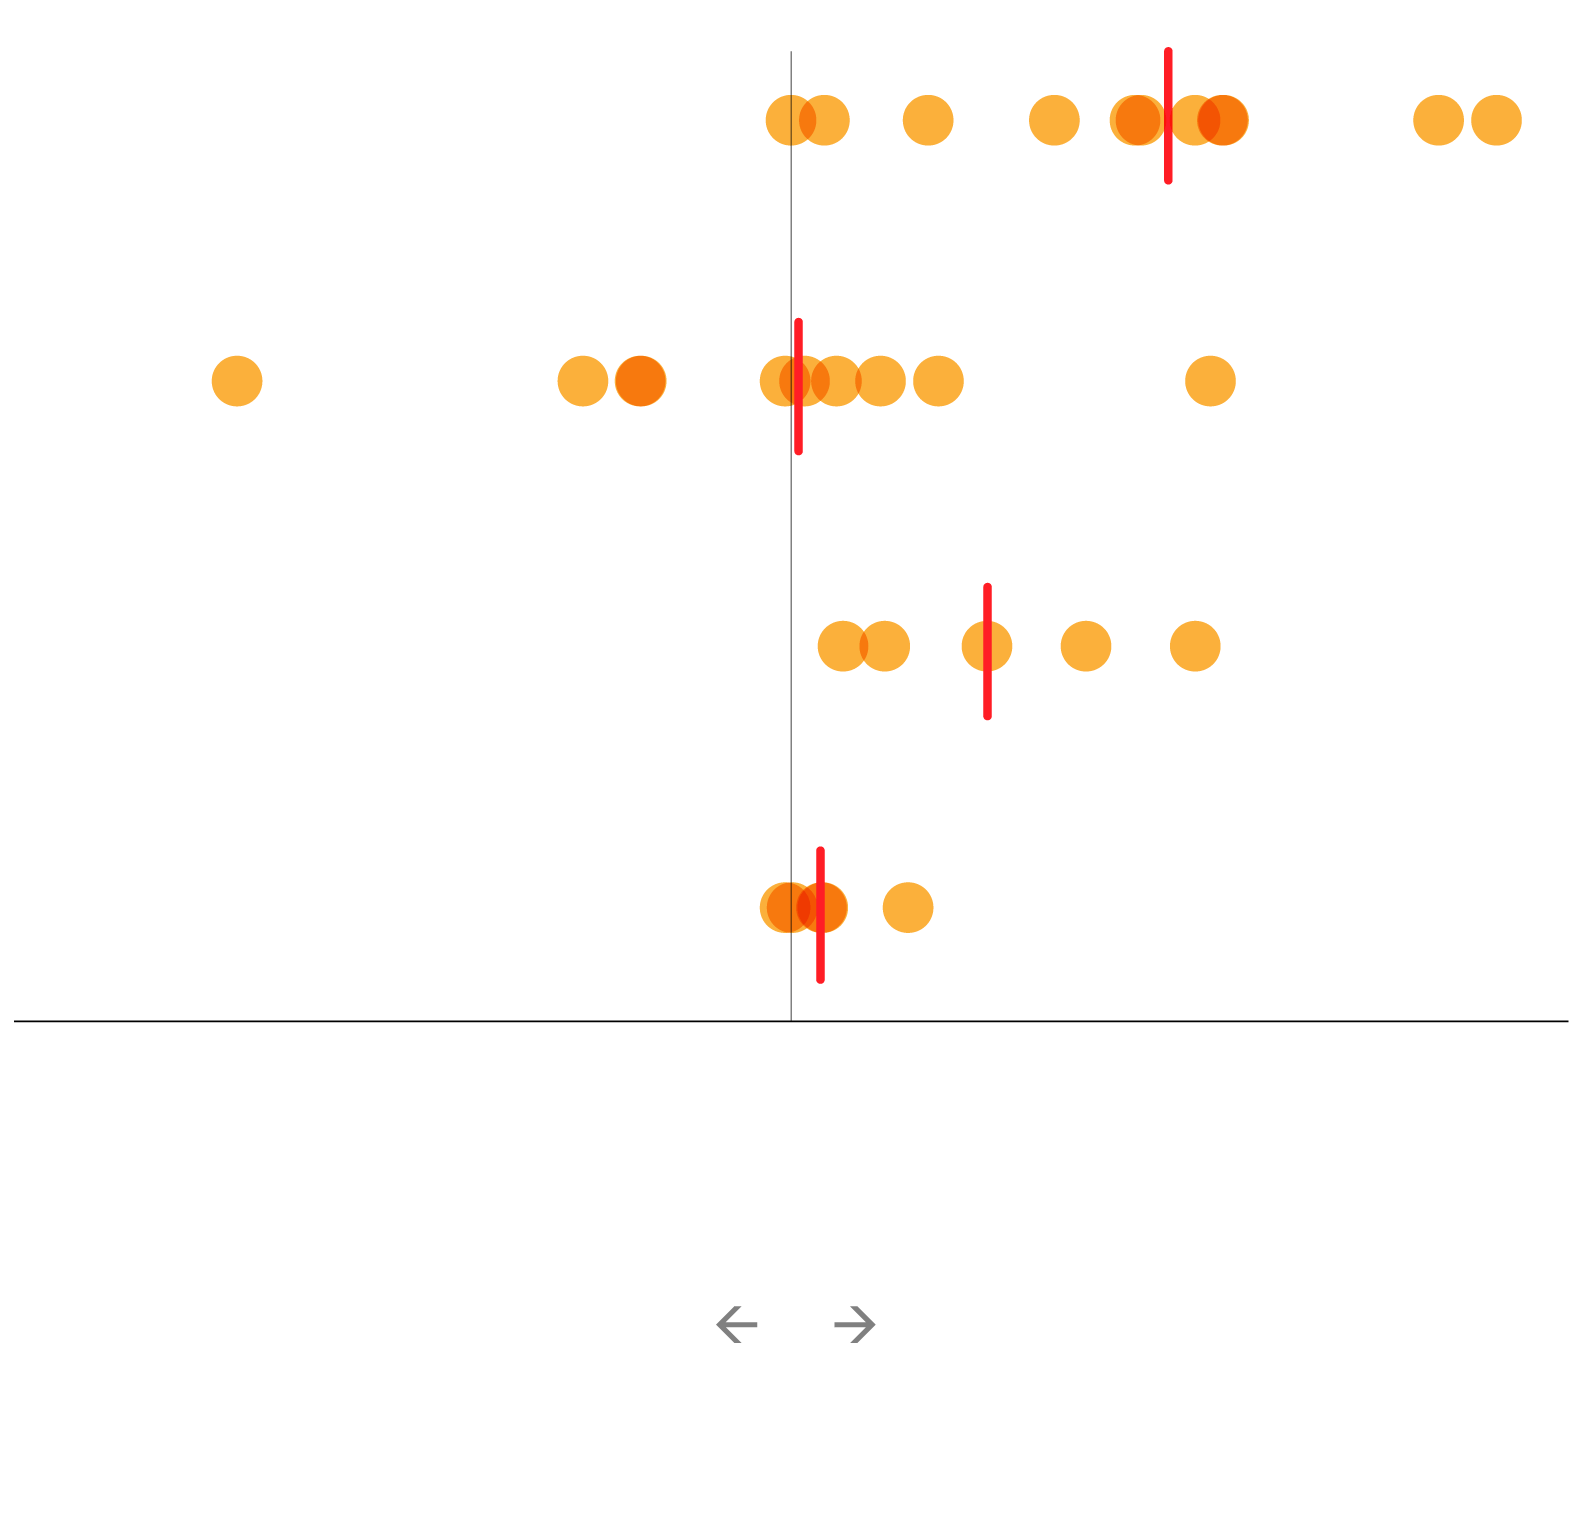
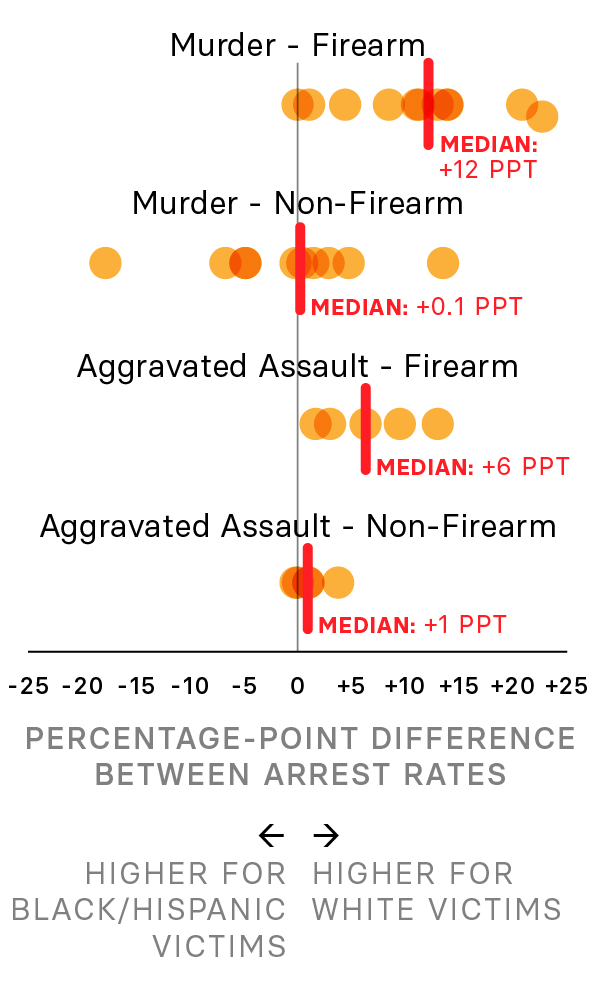
There is no analogous historical data available for assaults, but our analysis of present-day FBI and police data sets shows a similar pattern: Gun assaults of black and Hispanic victims are solved at lower rates. Arrest rates for non-gun assaults do not show a similar racial disparity.
The Trace/BuzzFeed News analysis of police data from agencies that recorded at least 20 incidents involving white victims and 20 incidents involving black and Hispanic victims between 2007 and 2016 (10 agencies for murders and 5 for assaults). Not all years or offense types were available for each agency.
There are many theories for why police solve a lower share of shootings when the victim is a person of color. Police officials often say they treat every case equally, but have more difficulty clearing cases involving black and Hispanic victims for a number of reasons, including witness intimidation and distrust of law enforcement. But black and Hispanic people in cities across the country frequently complain that police don’t seem to work as hard when someone is injured or killed in their communities.
3. If a gun assault is not solved quickly, odds are it won’t be solved at all.
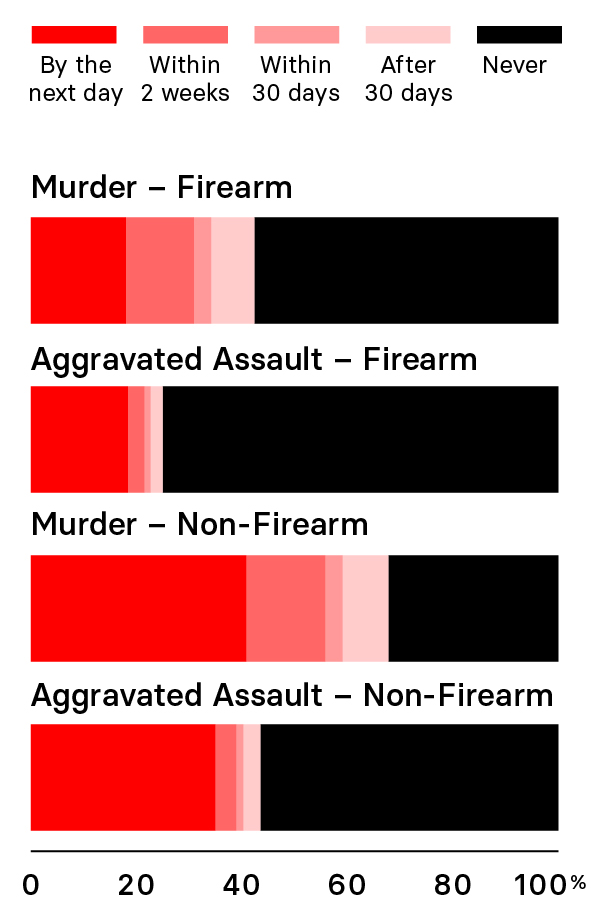
About 20% of gun murders and gun assaults are solved by the next day, according to our analysis. When a gun isn’t used, however, that rate doubles. “When you have an offense that involves a knife, or a hard object, or strangulation, that’s very personal,” former Houston homicide detective Brian Harris said. “It’s more close contact, more likelihood that you’re gonna have suspect DNA left at the scene, more likelihood that it’ll involve some kind of struggle and therefore draw attention.” Shooters, on the other hand, often fire from a distance, leaving little evidence behind.
The Trace/BuzzFeed News analysis of the FBI’s “National Incident-Based Reporting System” data for 94 urban police departments, 2007–16.
But if a gun assault is not solved during that first crucial early window, it’s far less likely to be solved at all. That’s in part because the detectives working gun assaults have caseloads exponentially higher than their counterparts on the homicide squad. Put another way: Police departments place a lower priority on cases in which a person is injured in a shooting but survives.
4. Detectives are stretched so thin in some cities that many nonfatal shootings don’t get investigated at all.
Homicide detectives are typically assigned between three and eight new murders per year. The workloads of their counterparts investigating nonfatal cases are much worse.
In fact, some big-city police departments have so few detectives handling nonfatal shootings that a significant share aren’t even assigned to an investigator. We collected dozens of staffing reports and found:
In Houston, a 2014 review warned that an “excessively high” number of cases with workable leads were not being investigated “due to lack of personnel,” including more than 3,000 serious assaults in the previous year. The new police chief started beefing up staffing on nonfatal shootings in mid-2017.
In Flint, Michigan, in 2013, the police department had only 14 investigators, who were assigned an average of 927 cases each. A spokesperson declined to release current caseloads, citing “safety reasons.”
In Oakland, more than 40% of the Felony Assault Unit’s cases were not assigned in 2017.
In San Jose, California, the police department’s 2017 annual report said the investigations bureau assigned detectives to roughly 4 out of every 10 cases. The percentage of cases assigned to investigators there has declined over the past decade.
In Portland, Oregon, police said they did not assign 38% of serious assaults for follow-up investigation in 2017.
In Cleveland, Ohio, in 2016, auditors found the detectives who handled nonfatal shootings, along with a variety of other types of cases, had “overwhelming” caseloads, including one detective who received 175 new cases during the first six months of the year.
In Anchorage, Alaska, in 2010, auditors found 90% of felony assaults were not assigned for investigation. Six years later, an audit found an even smaller number of cases were assigned. A spokesperson said only that more detectives have since been added, and assignments are done on “a case-by-case basis.”
5. When cities fail to solve nonfatal shootings, homicides often follow.
Increasingly, law enforcement experts are sounding the alarm that more resources need to be devoted to nonfatal shootings. “Someone who commits a nonfatal shooting may very well commit a homicide if not apprehended,” one prominent research firm said in a recent report detailing the Cleveland Police Department’s “troubling” response to these incidents.
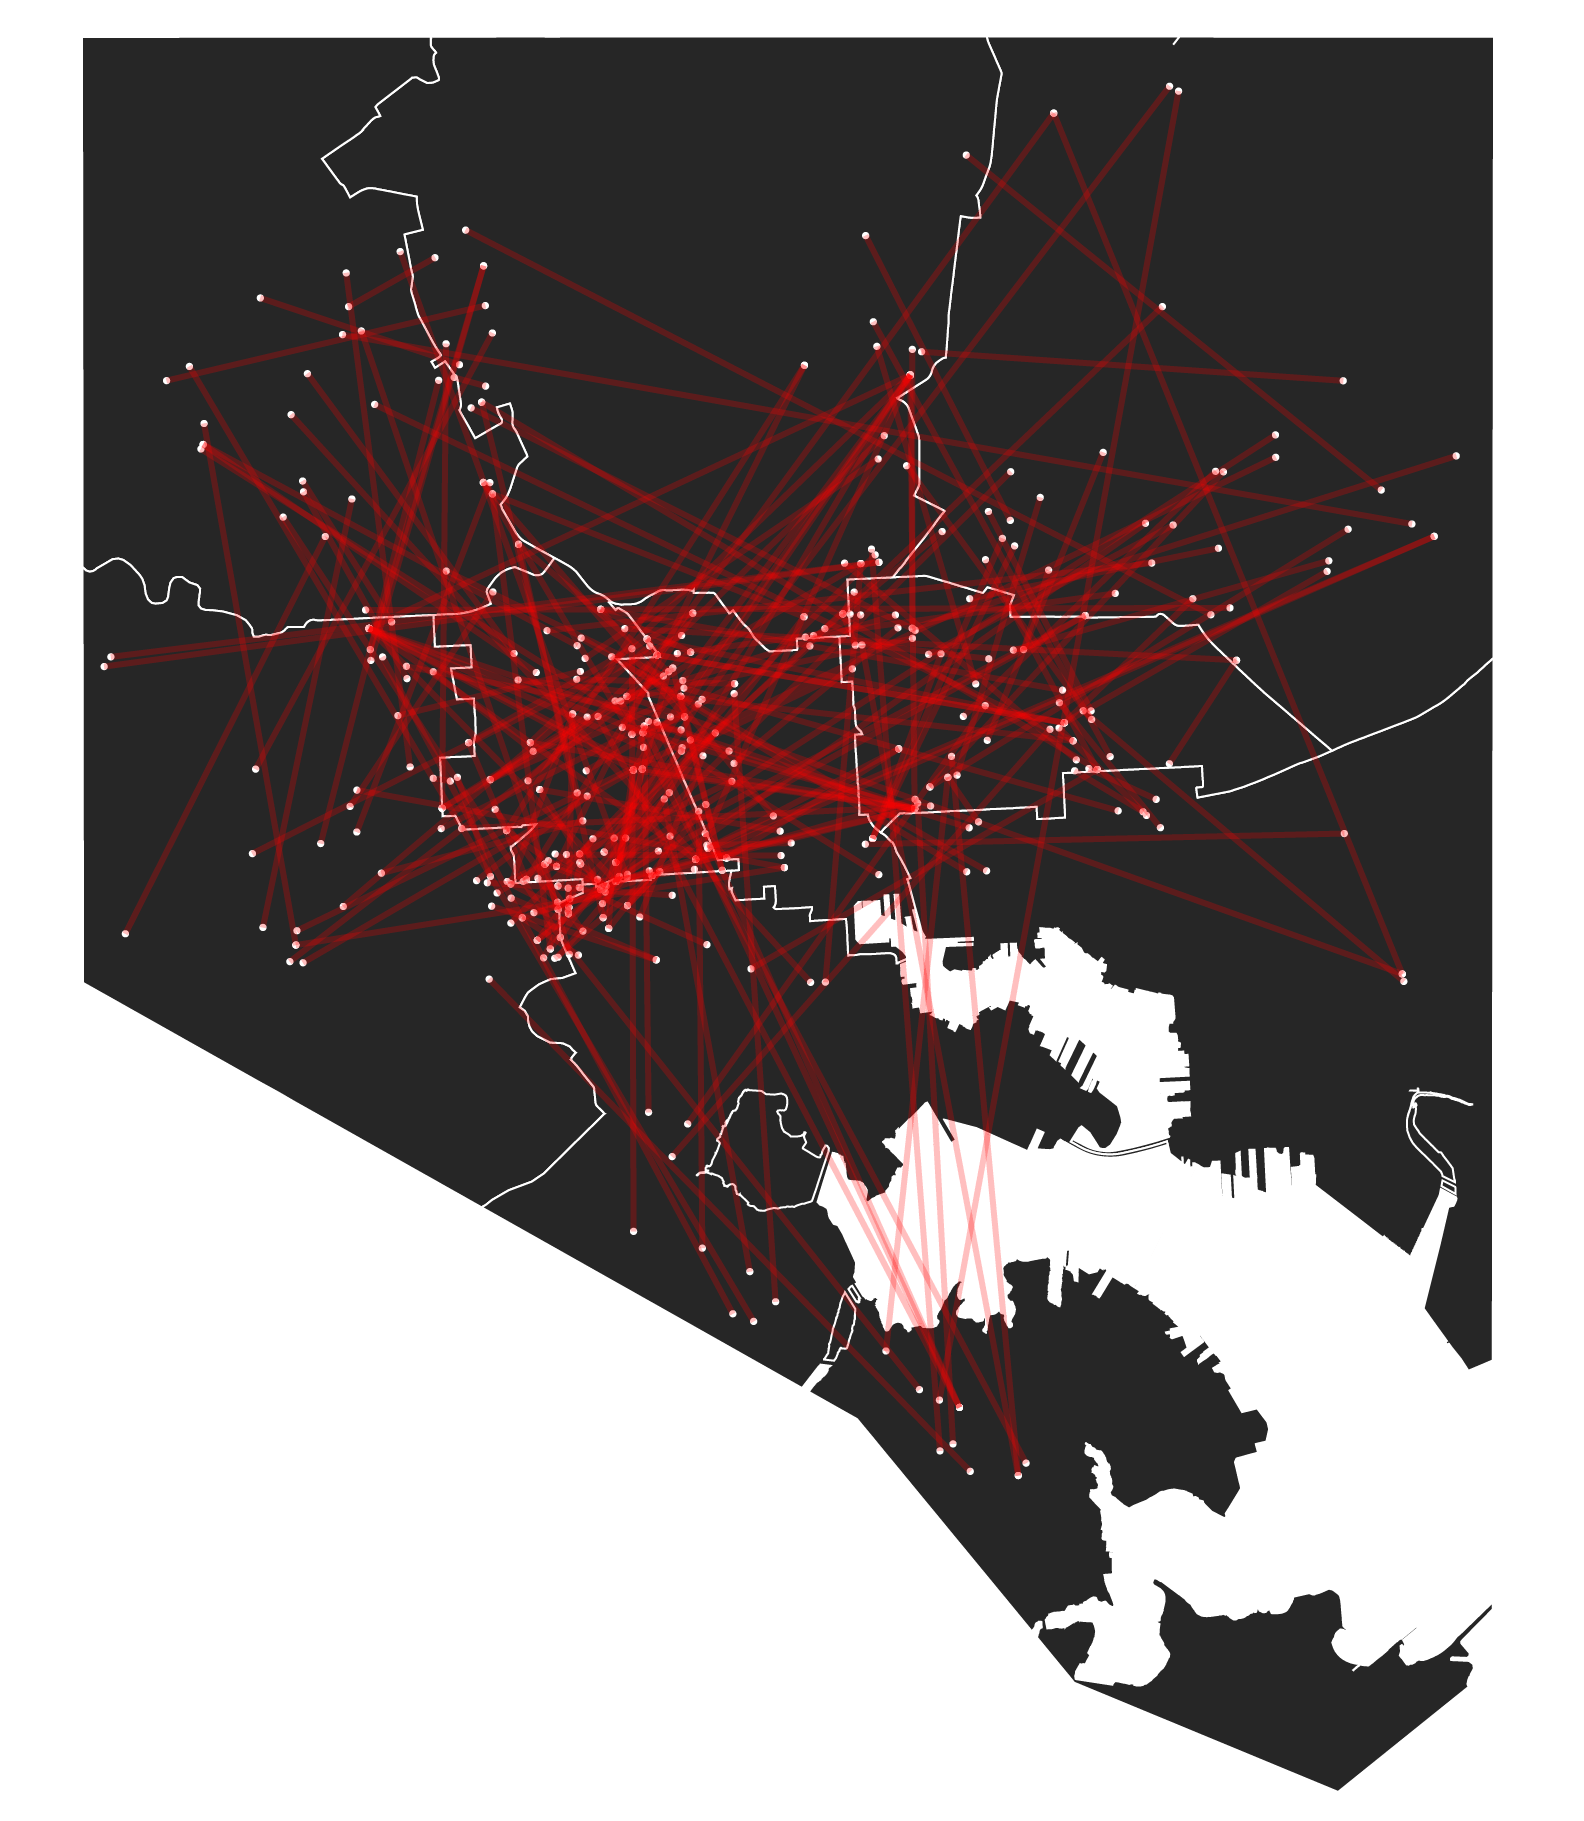
Data from Baltimore shows the scope of the problem. From the city’s police department, we obtained data on nearly 3,500 shootings that took place between 2012 and mid-2017, including the names and birthdates of the victims.
We were able to link one-quarter of the shootings to at least one other shooting through a common individual, but the true number is much higher — the records only listed a suspect in a third of the incidents.
More than 200 people were named as both a victim and suspect, potentially indicating chains of unchecked retaliatory violence, and 171 had been shot multiple times. There were 87 suspects named in multiple shootings — which together left 225 people dead or wounded.
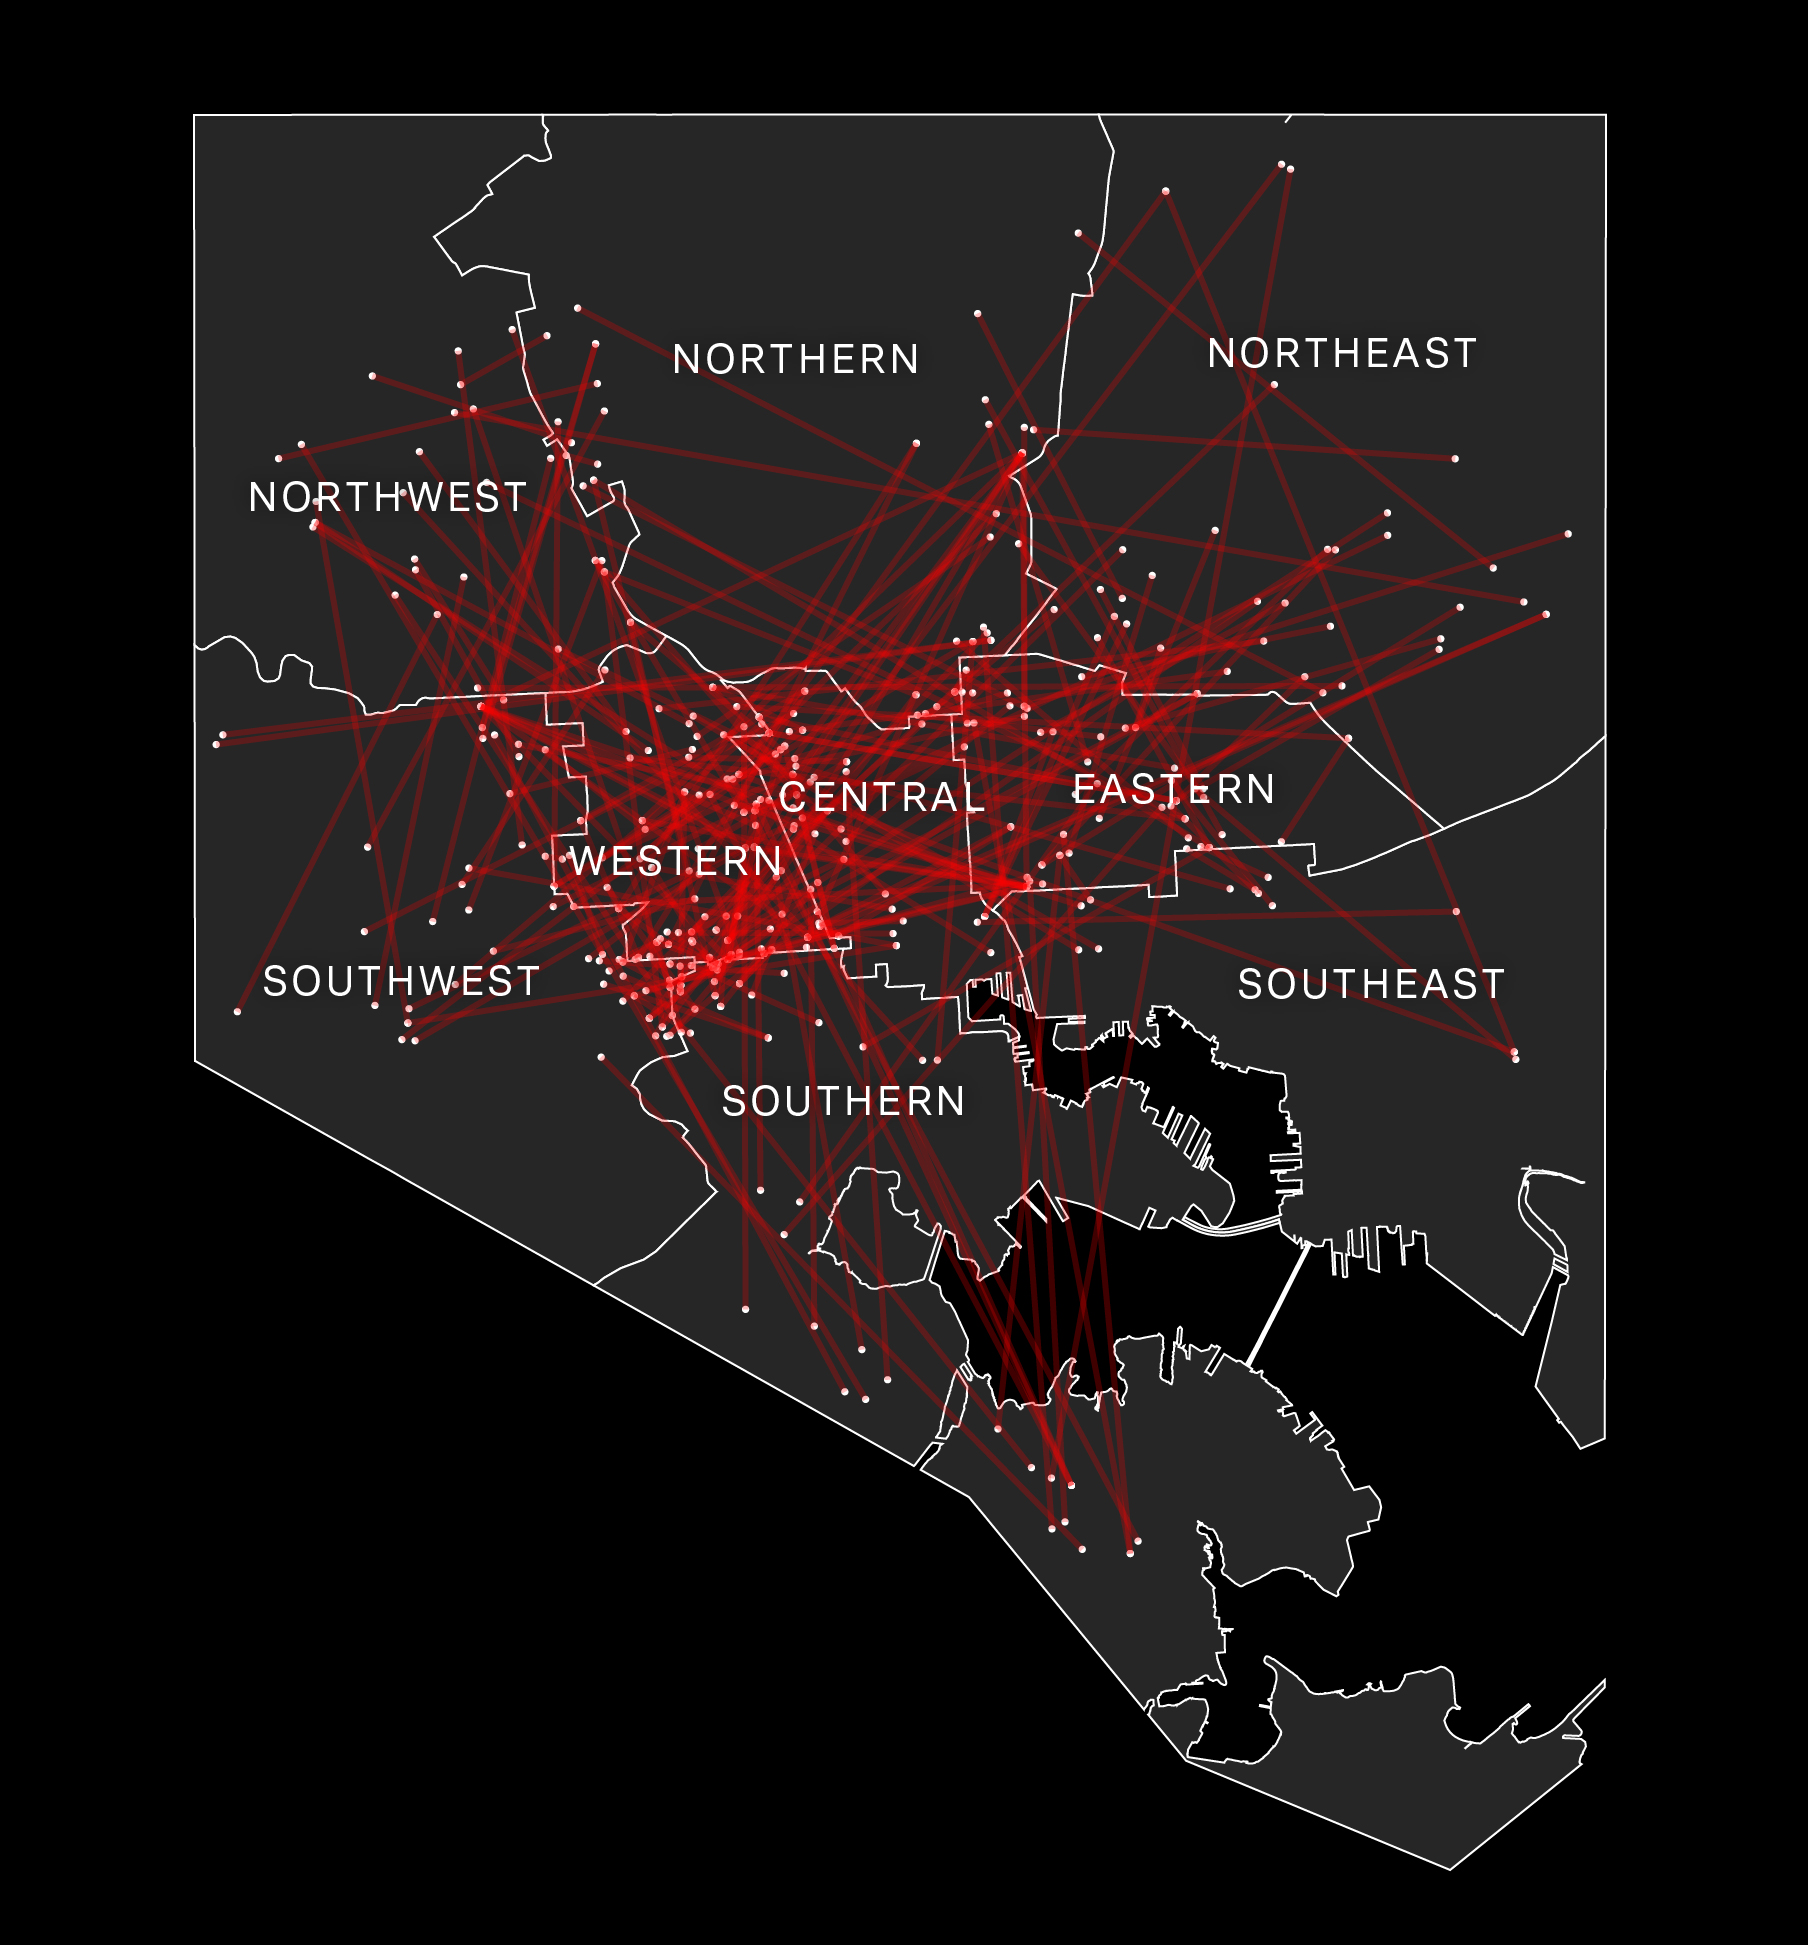
The Trace/BuzzFeed News analysis of Baltimore Police Department data, supplemented by Google Maps for address geocoding.
Many police departments assign shootings to different detective units based on whether the victim survived and, in some cities, where the incident occurred. But our analysis found shootings don’t fit such neat divisions on the streets. In Baltimore, fatal and nonfatal shootings were frequently linked, while the strings of violence frequently spilled over police district boundaries.
“Perhaps the most surprising and possibly important finding is that the connections between shootings occurred across large spaces as opposed to being geographically concentrated,” Daniel Webster, director of the Johns Hopkins Center for Gun Policy and Research, said of our analysis.
For a deeper understanding of why American shooters frequently go unpunished, read our story about nine intersecting Baltimore shootings and why all but one remain open.
Our complete data, code, and methodology can be found on our GitHub page. ●


