
Though Americans are constantly warned of the prevalence and danger of cyberattack, the concept remains totally abstract for most people. The reason isn't just that people don't understand the methods by which governments and hackers try to gain access to and disrupt private networks, it's that the scale of the problem itself is difficult to fathom.
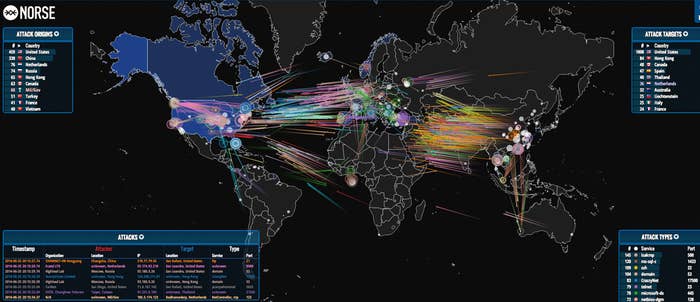
That shouldn't be a problem anymore. The Norse Corporation, a San Mateo-based cyber-intelligence startup, just released a Live Cyber Attack Map, a real-time depiction of cyberattacks across the globe. And it is as scary as it is fascinating.
Below are just a few seconds of the map in action:
Norse draws from an enormous data network—nearly 150 data centers in 40 countries around the world—to process more than 130 terabytes of information a day. Much of that data comes from Norse's more than 8 million "honeypots", computers owned and monitored by Norse that emulate programs (more than 6,000) that are attractive to cyberattackers, like ATM software and corporate email. The data for the live map comes entirely from these honeypots.
To give a sense of the gargantuan scale of the global cyberwar, the live map represents less than 1 percent of Norse's total data; if the whole shebang were projected onto the screen it would be hard to make out the map below. (Which, yes, bears an uncanny resemblance to WarGames.)
The vast majority of the attacks you see are automated scripts (bots) designed to expose vulnerabilities in outdated networks. The little box in the lower righthand corner displays what kind of networks are being attacked (for example, SSH corresponds to attacks on remote desktop networks, and SiP corresponds to attacks on voice-over IP networks.) According to Norse Senior Director of Product Marketing Jeff Harrell, most attacks look scattershot on the map, but occasionally a giant coordinated group of attacks—a distributed denial of service attack—will appear, often emanating from China, like the one below.
The major sources of—and destinations for—cyber attack are, as you'd imagine, the US and China. And for all of our national alarmism about unchecked Chinese cybercrime, it appears that the US generates just as many cyberattacks as their Asian rivals.
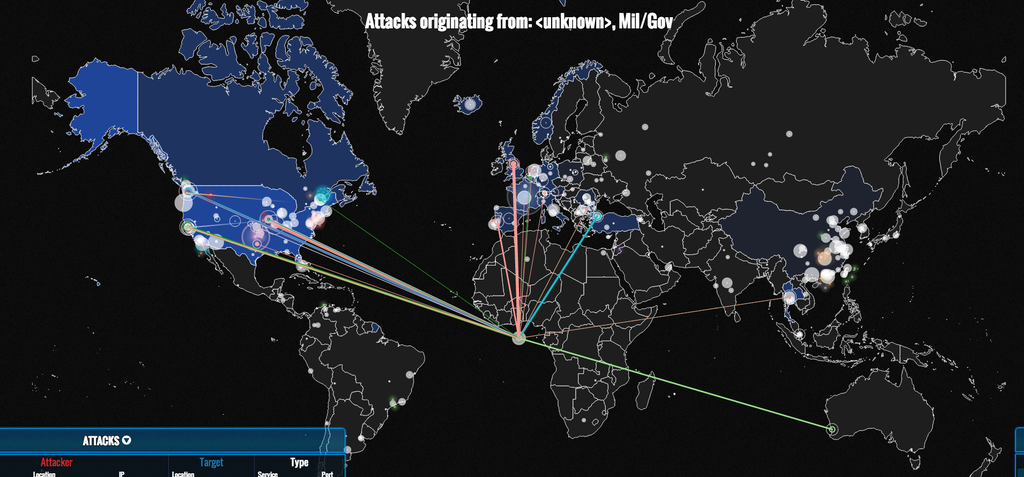
And if you happen to notice an enormous node of activity in the Gulf of Guinea with the mysterious tag ", Mil/Gov", that's not because there is a top secret American megacyberbase off the coast of Sao Tome. It's because Norse automatically places cyberattacks into and out of the American government—which are classified—on the Equator.
Of course, much of this cybercrime is crude, small-time, and hardly represents a threat to global security. But at its largest scale, such as a recently-exposed tranche of 1.25 billion stolen email addresses, cyberattacks can effect huge swathes of the world population.
What this map doesn't tell you is which attacks come from private citizens and which attacks come from governments or other large organizations. That data is limited to Norse's paying customers (governments and large organizations). Still, just a quick glance at the live map should be enough to convince even the casual web user to change his password from "12345".