
Sure, you think. The Middle East is an area of the world that gets hot. But over the last few days, the temperatures there have soared to dangerous levels.
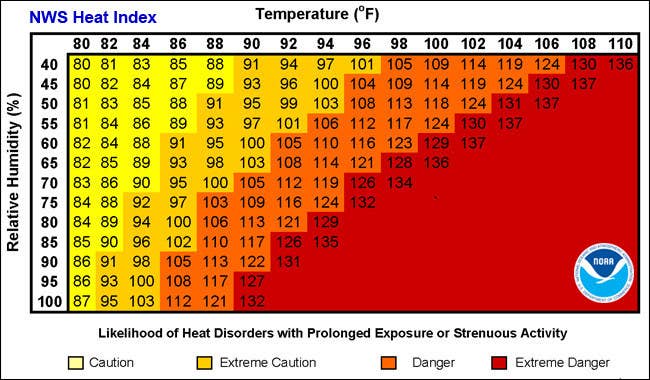
How bad is it? The National Weather Service has what they call the "Heat Index" chart to show what the environment feels like with both temperature and humidity taken into account. But in some countries, the effect is heat that's literally off the charts.
Here's an example of some of the worst hot spots over the last few days:
Sidon, Lebanon — Aug. 3, 2015
Temperature: 100ºF
Dew Point: 59ºF
Heat Index: 100ºF
"Oh No I Am Melting" Index: 😓😓
At least Beirut managed to (mostly) solve its trash problem before this heat wave struck.
Jericho, West Bank — Aug. 2, 2015
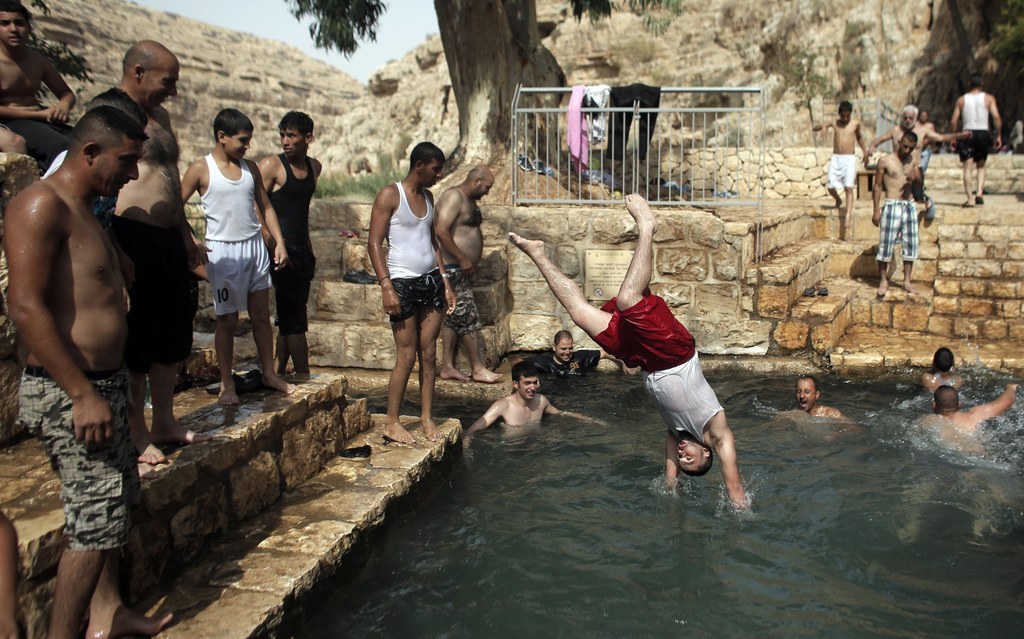
Temperature: 96ºF
Dew Point: 75ºF
Heat Index: 108ºF
"Oh No I Am Melting" Index: 😓😓😓
These lucky folks had access to this natural spring in Ein Fawwar. But other parts of the Jordan Valley reached up to nearly 118ºF.
Beit Hanoun, Gaza Strip — July 31, 2015

Temperature: 101ºF
Dew Point: 77ºF
Heat Index: 118ºF
"Oh No I Am Melting" Index: 😓😓😓😓
The heat in the Gaza Strip would be sweltering under any circumstances. But, as in the case of these Palestinian children cooling off in the yard of the ruins of their family house, the conditions for those whose homes were destroyed during last summer's Israel-Hamas war are insanely hard to handle.
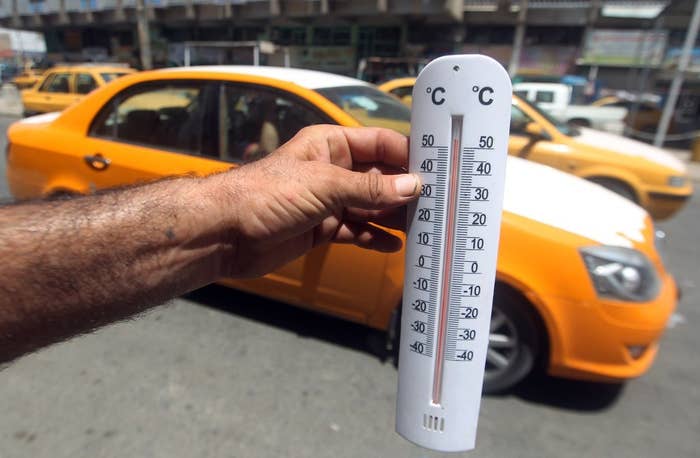
Baghdad — July 30, 2015
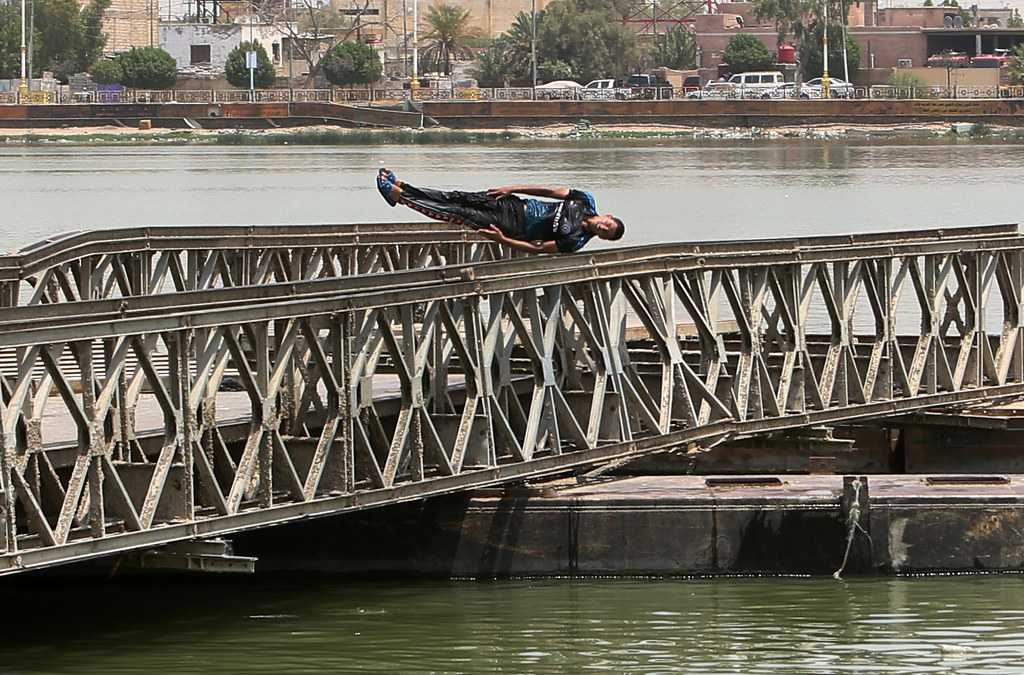
Temperature: 122ºF
Dew Point: 37ºF
Heat Index: ¯\_(ツ)_/¯
"Oh No I Am Melting" Index: 😓😓😓😓😓
Baghdad, being in the middle of the area whose climate you most think of when you think of the Middle East, is usually oppressive during the summer. But with temperatures soaring — and power shutoffs causing people to take to the streets in protest — the city was nearly intolerable this weekend.
Bandar Mahshahr, Iran — July 30, 2015

Temperature: 115ºF
Dew Point: 90ºF
Heat Index: "Why"
"Oh No I Am Melting" Index: 😓😓😓😓😓
The mind reels.
The heat index figures for each of the countries has been corrected. The original figures were improperly calculated.